PLS-CADD
Power Line Systems - Computer Aided Design and Drafting
PLS-CADD is the most powerful overhead power line design program on the market. PLS-CADD runs under Microsoft Windows and features an easy to use graphical user interface. It integrates all aspects of line design into a single stand-alone program with a simple, logical, consistent interface. No other program can match the sophisticated engineering capabilities available in PLS-CADD. This sophistication and integration leads to more cost-effective designs being produced in only a fraction of the time required by traditional methods. The PLS-CADD solution is so clearly superior to any alternative that it has been adopted by more than 1600 organizations in over 125 countries.
Three-Dimensional Engineering Model
At the heart of PLS-CADD is a sophisticated three-dimensional engineering model. This model includes the terrain, the structures and all the wires. The model can be viewed in a number of different ways: profile views, plan views, plan & profile sheets, 3-D views, staking lists... The PLS-CADD model is much more than just a picture or CAD drawing since PLS-CADD understands the relationship between these elements. When you drag a structure off the current alignment PLS-CADD will generate new profiles and update all affected structure and wire positions. The effects of this structure move will be instantly visible in all views including the plan & profile sheet view. In PLS-CADD you concentrate on designing your line instead of wasting your time drafting.

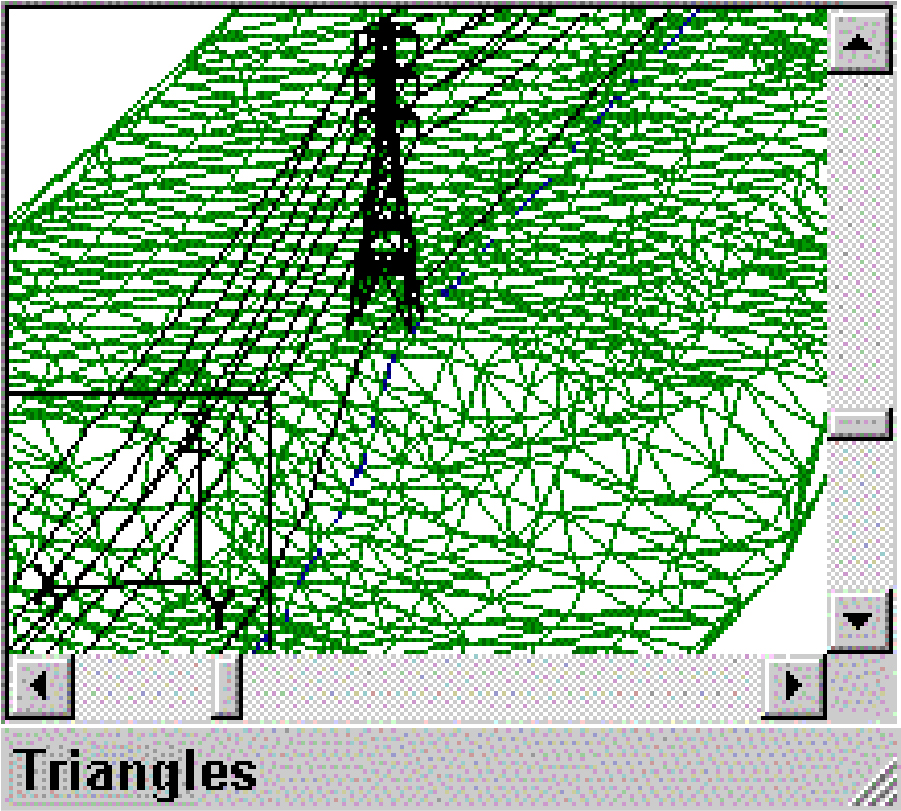
Terrain Model
PLS-CADD easily adapts to the wide range of technologies used for line surveys including total station instruments, airborne lasers and photogrammetry. It accepts survey data in both the plan and the profile coordinate systems. Survey data can be keyed in, can be digitized using the built in heads-up digitizer, or can be electronically imported from a survey data file. PLS-CADD has a customizable data import routine that can read a wide range of survey data formats.
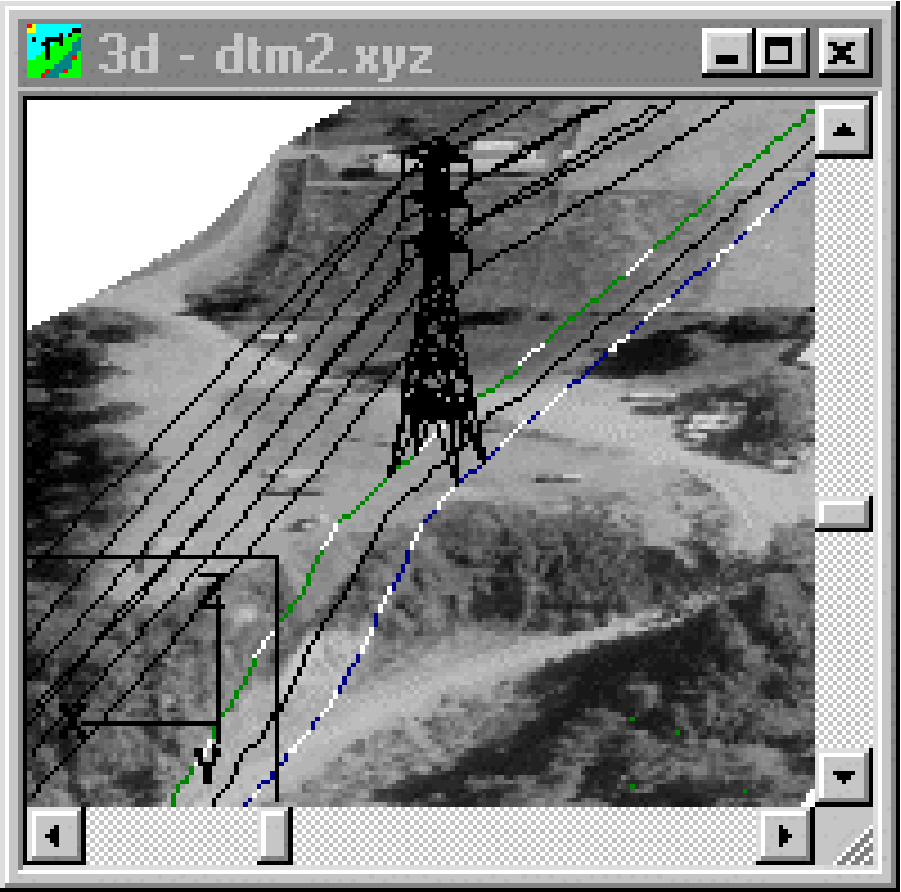
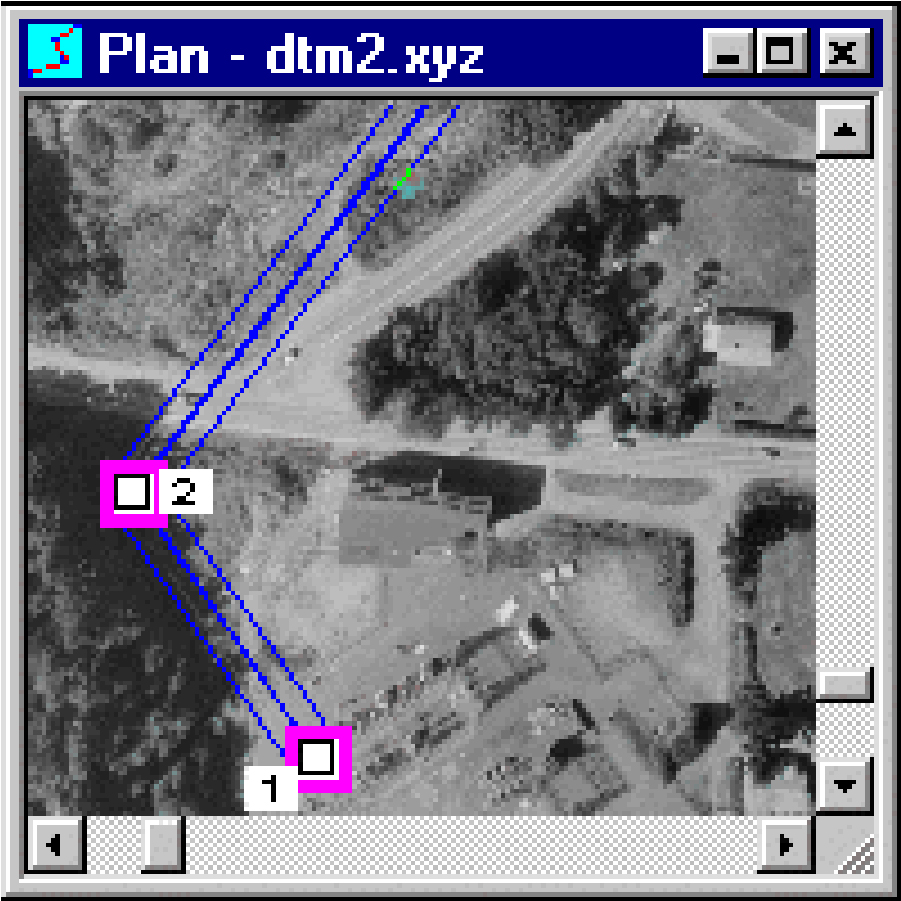
Superposition of planimetric maps and aerial photographs can be used to better visualize the area around your line. When sufficient data are available PLS-CADD can give you an even better perspective using contour lines, color renderings and even draped aerial photographs.


Altering your line route is easily accomplished by dragging P.I. points with the mouse or by clicking on locations where you want to add or delete P.I. points. Line route changes are instantly reflected in all views.
Engineering Standards & Calculations
PLS-CADD’s engineering functions are very flexible and are easily adapted to conform to your standards. You start by defining the combinations of wind, ice, temperature and safety factors you wish to use. Next, you tell the program which combinations to use for loading trees, for insulator swing checks, for clearance checks, wire tension checks... PLS-CADD will check things your way. You can work in either imperial or metric units and can even switch back and forth between these unit systems. The fact that over 125 countries use PLS-CADD is a testament to its adaptability to a wide range of standards.
Once standards are setup you are only a few mouse clicks away from engineering calculations. Select "Structure/Check" and click on a structure and you are told if you have a structure strength or insulator swing problem. Select "Section/Sag-Tension" and click on a span and you get a sag-tension report. Clearances, loading trees and many other functions are just as easily accessed.
PLS-CADD supports both automatic and manual spotting. With manual spotting you use the mouse to add, delete, edit or move a structure. In automatic spotting the program spots structures for you to obtain the lowest cost design possible subject to your constraints. Automatic spotting often results in designs as much as 10% lower in cost than human generated designs. PLS-CADD gives you the best of both the automatic and the manual spotting worlds: cost and time savings while still maintaining control.
Advanced Sag-Tension
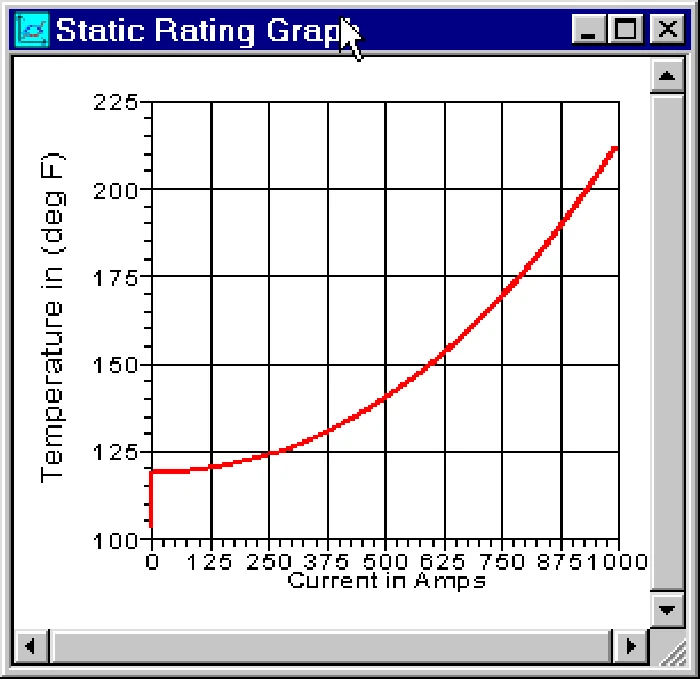
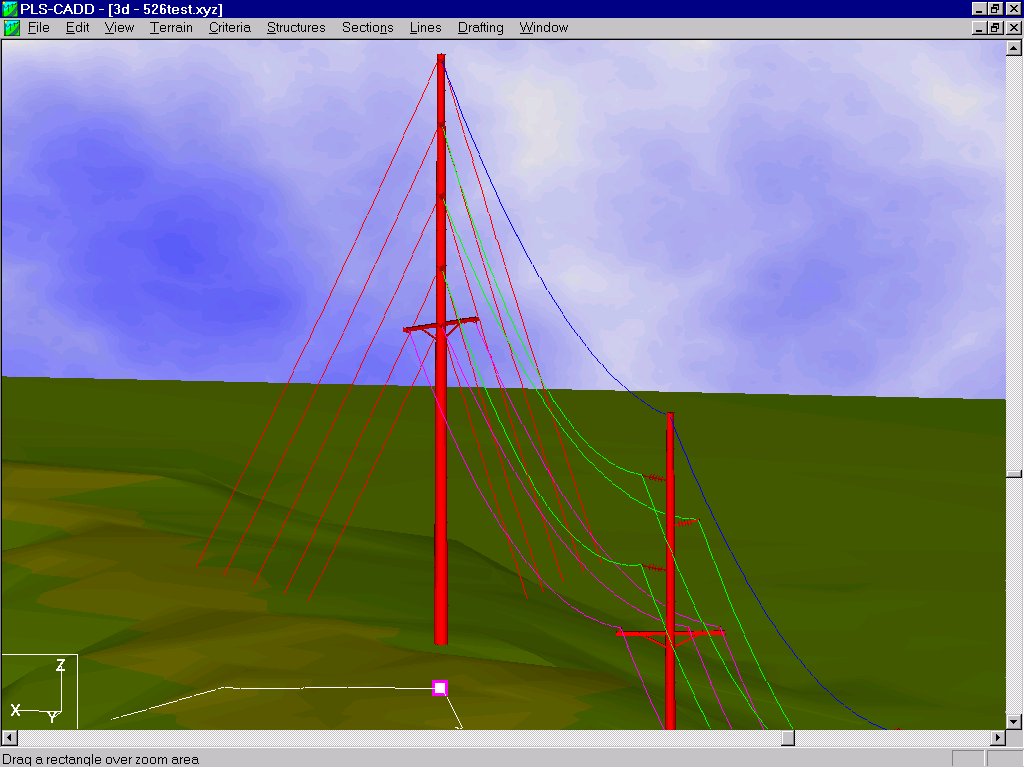
PLS-CADD has built in sag-tension routines. You can quickly display your line in 3-d for any weather condition complete with insulator swings and wire blowout. Clearances from wires to ground or between phases can also be calculated under any weather conditions. Loading trees, stringing charts, galloping ellipses, IEEE Std. 738 and Cigre Brochure 207 thermal ratings, and offset clipping results are all easily accessed.
PLS-CADD goes beyond ordinary sag-tension programs. Running ACSR conductors at high temperature can cause the aluminum strands to go into compression. Most sag-tension programs do not model this effect and thus underestimate the sags. PLS-CADD can model your line both with and without the compression effect so you can see how severe it is.
Like most line design programs, PLS-CADD uses ruling span approximations in its sag-tension calculations. Unlike these other programs, PLS-CADD can work together with our SAPS multi-span finite element sag-tension program when the ruling span isn't appropriate. When used in this manner PLS-CADD bypasses its built in sag-tension routine and uses SAPS instead. This allows modeling of broken conductors, unbalanced ice, marker balls, and flexible structure scenarios that are incompatible with ruling span approximations. It also allows fixing the length of wire in each span to see the impact of moving structures, inserting structures or cutting out wire in an existing line.
Structure Modeling
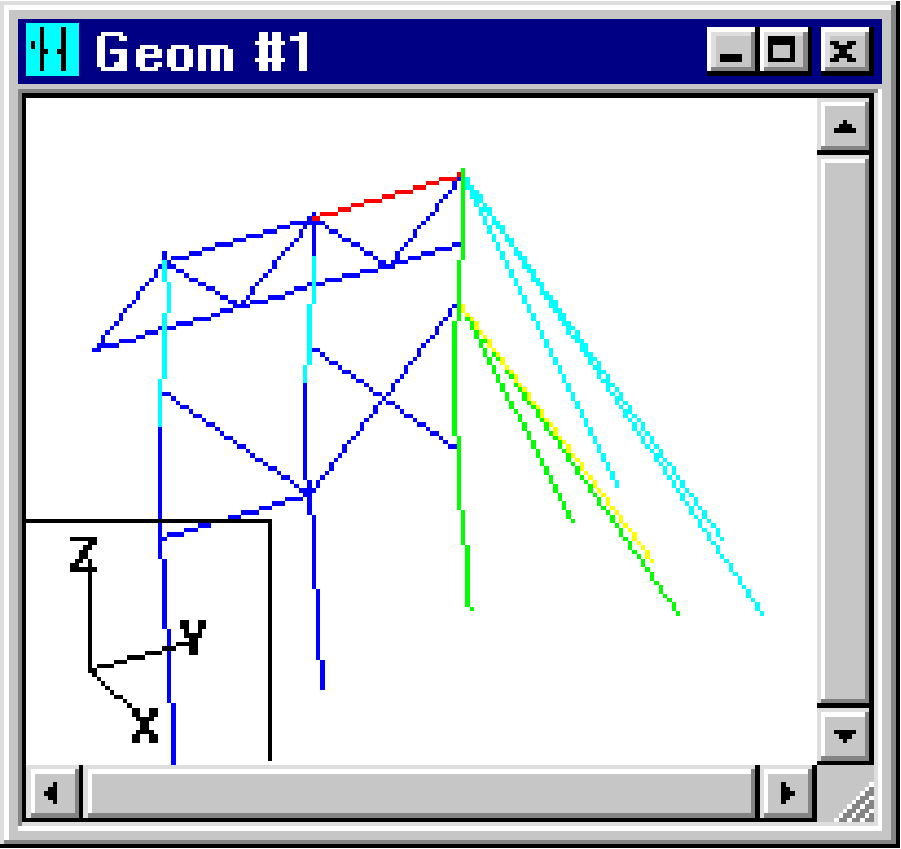
PLS-CADD provides several methods for modeling structures. The simplest is the wind & weight span method for which you need only enter values of allowable wind & weight spans, allowable suspension insulator swing angles and the coordinates of the wire attachment points. A far more powerful method of modeling structures is available when using our structure programs. These programs construct a finite element model from some basic input quantities such as pole height, pole class, cross-arm size and guy placement. When such a structure is checked PLS-CADD not only tells you if the structure is adequate but it also displays a color-coded picture showing which parts of the structure are most highly stressed. You have complete flexibility in changing tensions, conductors and loading agendas and can see the results of these changes on structure usage in seconds. Guyed structures, frames and even lattice towers are all easily accommodated. This method is ideal for upgrade studies of existing lines and is far more powerful and accurate than any other alternative.

Material Subsystem
PLS-CADD features a powerful material subsystem for cost estimation and material list generation. Parts data such as stock-number, part description, cost and custom user defined columns can be entered directly into PLS-CADD. Next, assemblies can be created from parts and/or other assemblies. Alternatively, PLS-CADD can extract parts information from an existing company database. All ODBC compliant databases such as Oracle, Access and DB2 are supported and PLS-CADD is easily configured to access existing database schemas.
Parts and assemblies are tied to structures enabling PLS-CADD to estimate the cost of structures or your entire line. A number of different material and staking list reports are available and can be easily exported to spreadsheets or ODBC databases for use in asset management or work order systems.
Drafting
PLS-CADD totally automates plan & profile sheet drafting. Your plan & profile sheets are updated real-time as you make changes to your design. With a few keystrokes these sheets can be plotted to a Windows compatible printer/plotter or they can be imported into your CAD system. Planimetric drawings, aerial photographs, custom drawing borders, title blocks and company logos are all automatically integrated into these drawings. Once again, PLS-CADD adapts to your standards giving you full control over page size, page layout, text size, scales and many other sheet parameters. Customers typically report that PLS-CADD reduces their drafting time by over 95%.
Summary
PLS-CADD addresses the reality that terrain modeling, engineering, spotting, and drafting are not disjoint processes but are all interrelated. By integrating all these functions into a single environment PLS-CADD streamlines the design process. The result is simplicity, flexibility and efficiency not attainable when using a collection of programs from different vendors. PLS-CADD’s engineering features are unsurpassed giving you the state-of-the-art in sag-tension, structural analysis and automatic spotting. From distribution wood poles all the way to 500 kV or higher guyed frames and lattice towers, PLS-CADD has the power and flexibility to do it all. Proven in over 1600 organizations in more than 125 countries, PLS-CADD is the worldwide standard in line design.
If you would like more information about PLS-CADD please Contact Us.
Summary of Features
A Microsoft Windows 10 or 11 (x64) environment that lets you:
Run on powerful yet inexpensive computers
Use the most common graphical user interface (GUI) in the world
Print reports and plot drawings directly on a wide variety of printers and plotters
Run the user interface in English, French or Spanish
A 3-dimensional terrain model (including automatic TIN triangulation) that lets you:
Select your route by clicking the mouse on line angle points
Move structures in the plan or profile views
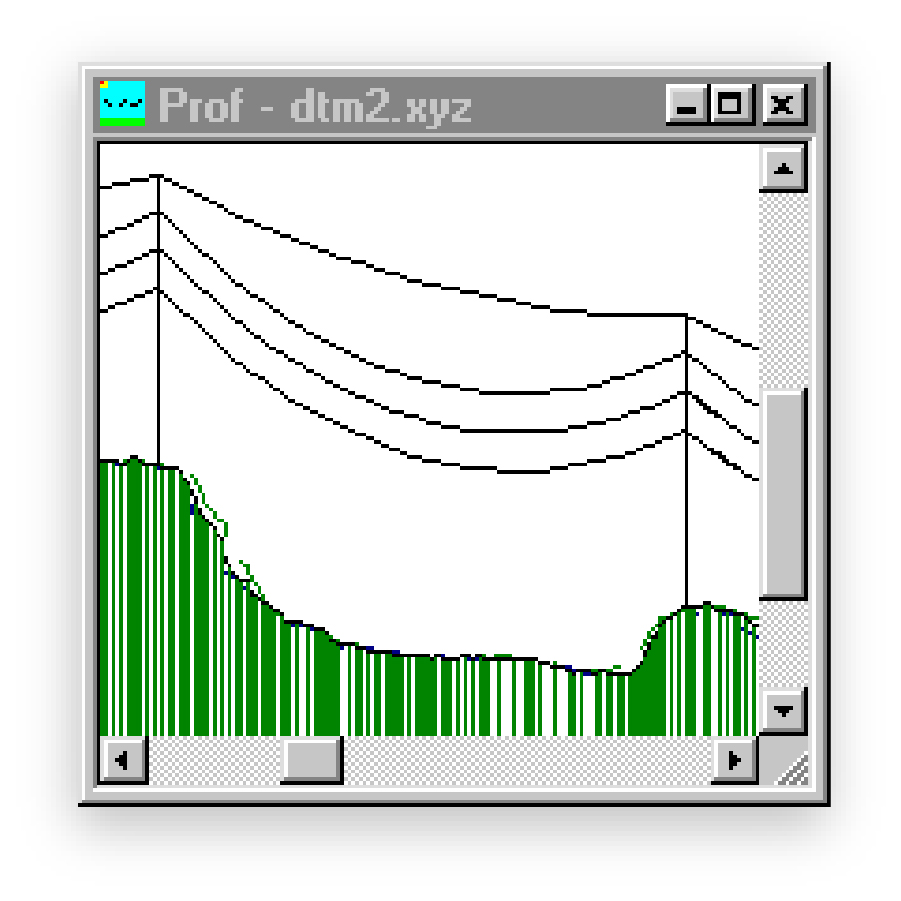
Automatically generate centerline or side profiles
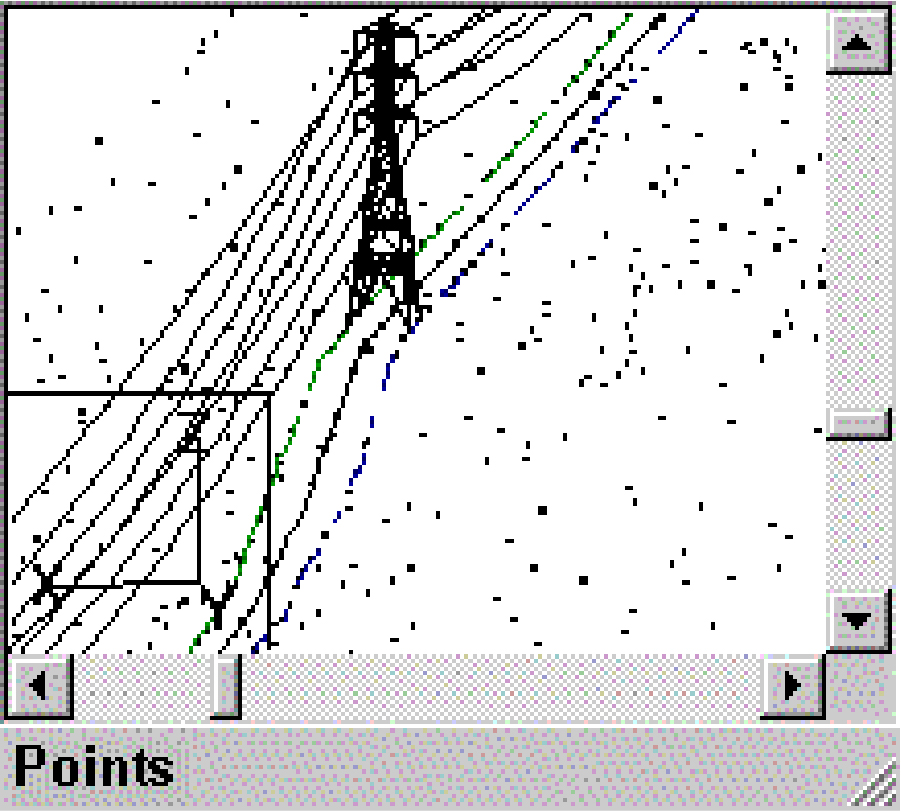
Identify any terrain or obstacle with a unique feature code and symbol
Automatically draw the required vertical clearance line for any specified voltage
Render terrain in color by elevation and light incidence
Import terrain data from GPS, photogrammetry or total station surveying equipment
A simple system for strength and clearance design criteria that lets you specify:
Weather cases with individual wind, ice, temperature, and reliability adjustments
Load factors for checking the strength of the structures
Cable conditions (Initial, after Creep or after Heavy load)
A 3-dimensional model of the line that lets you:
Represent all structures with all attached cables and insulators
Select structures and cables from user editable libraries
Spot structures interactively or automatically (global cost optimization)
String and sag the line interactively or automatically
Perform any sag and tension calculation, including the effect of creep
Select various conductor models to better represent behavior at high temperature
Determine complete design loading trees
Compute vertical or lateral clearances from ground or obstacles to any cable
Check structure strength by allowable wind and weight spans methods
Check structure strength by direct link to structural analysis programs
Check clearances between conductors and structures (including guy wires)
Visualize the line in 3-d with actual wind blowout and insulator swings
A graphics system that lets you:
Generate plan & profile sheets automatically
Control drawing scales and page layout
Plot directly or send drawings to commercial CAD system
Export plan & profile sheets to PDF (requires Adobe Acrobat)
Superpose aerial photographs or maps on your plan view
Digitize scanned plan & profile drawings
A material management system that lets you:
Import parts, assemblies and labor units from existing databases
Automatically generate structure costs for optimization
Automatically generate material lists for construction
Technical Notes A complete list of technical notes is available here. These include topics such as terrain modeling, engineering calculations, sag-tension and finite element sag-tension, drafting and materials as well as a variety of miscellaneous topics.
Videos: A variety of videos that demonstrate features are available here.
Information for Prospective Clients
Frequently Asked Questions Regarding the Purchase of PLS Software
PLS-CADD Contour Lines and Draped Bitmap
PLS-CADD Rendered Digital Terrain Model
PLS-CADD Plan & Profile Sheet With Page Border, Plan Overlay, Logo and Aerial Photo
Re-Engineering The Transmission Line Design Process by Otto J. Lynch and Peter Hilger
Using FLI-MAP ™ data in PLS-CADD
PLS-CADD Digitizing Interface
Rendering Examples
USGS Examples
Gantry Example
These are just a few of the surveyors who are familiar with PLS-CADD:
